CSEC
Do you know?
India Water Facts
Water Resources of India
Surface Water
India is a water rich country with 4% of world’s water resources(India-WRIS wiki 2015). The rivers have been the heart and soul of the India’s growth as well as culture. Among them, 12 rivers are classified as major river which are catering about 253 mha of catchment area and 46 as medium river with 24.6 mha of catchment area. Many of the river systems with their tributaries are perennial and some of them are seasonal. The Ganga-Brahmaputra-Meghna system is the largest river system in India with 43% of the catchment area of the all major river systems. The other major river systems are Indus, Sabarmati, Mahi, Narmada, Tapi, Brahmani, Mahanadi, Godavari, Krishna, Pennar and Cauvery. Apart from that, there are several other medium rivers systems of which Subernarekha (with 1.9 mha catchment area) is the largest (Dhawan 2017, Central Water Commission 2015).
Other than rivers and canals, other inland water resources include numerous reservoirs, tanks and ponds, beels, oxbow lakes, derelict water and brackish water, which cover almost 7 mha of area. They are unevenly distributed over the country with Orissa, Andhra Pradesh, Gujarat, Karnataka and West Bengal possessing more than 50% of these inland water resources.
Table 1 Surface water resources potential of river basins of India (Central Water Commission 2010)
| Sl. No. | River Basin | Catchment area (sq.km) | Avg. Water Resources Potential (BCM) | Utilizable surface water resources (BCM) |
|---|---|---|---|---|
| 1 | Indus (up to border) | 321289 | 73.31 | 46 |
| 2 | a) Ganga | 861452 | 525.02 | 250 |
| b) Brahmaputra | 194413 | 537.24 | 24 | |
| c) Barak & Others | 41723 | 48.36 | ||
| 3 | Godavari | 312812 | 110.54 | 76.3 |
| 4 | Krishna | 268948 | 78.12 | 58 |
| 5 | Cauvery | 81155 | 21.36 | 19 |
| 6 | Subarnarekha | 29196 | 12.37 | 6.8 |
| 7 | Brahamani & Baitarni | 51822 | 28.48 | 18.3 |
| 8 | Mahanadi | 141589 | 66.88 | 50 |
| 9 | Pennar | 55213 | 6.32 | 6.9 |
| 10 | Mahi | 34842 | 11.02 | 3.1 |
| 11 | Sabarmati | 21674 | 3.81 | 1.9 |
| 12 | Narmada | 98796 | 45.64 | 34.5 |
| 13 | Tapi | 65145 | 14.88 | 14.5 |
| 14 | West flowing rivers From Tapi to Tadri | 55940 | 87.41 | 11.9 |
| 15 | West flowing rivers from Tardi to Kanyakumari | 56177 | 113.53 | 24.3 |
| 16 | East flowing rivers between Mahanadi & Pennar | 86643 | 22.52 | 13.1 |
| 17 | East flowing rivers between Pennar and Kanyakumari | 100139 | 16.46 | 16.5 |
| 18 | West flowing rivers of Kutch and Saurastra including Luni/td> | 321851 | 15.1 | 15 |
| 19 | Area of inland drainage of Rajasthan | 36202 | 0 | NA |
| 20 | Minor river basins draining in to Myanmar & Bangladesh | 31 | NA | |
| Total | 1869.35 | 690.1 |
Monsoon precipitation has been the lifeline of India with respect to agriculture as well as recharging its water resources. India receives about 4000 bcm of average annual precipitation along with snowfall, of which 3000 bcm is received in the monsoon season (June-September). The spatial distribution of precipitation widely varies over the country (<100 mm in Rajasthann to >2500mm in Assam)(Central Ground Water Board 2014). Less than 50% of total precipitation flows to the rivers and it is estimated as 1869 bcm. However, only 690 bcm surface water resources can actually be utilised(Central Water Commission 2015).
Ground Water
Ground water is a replenishable resource. The agriculture, industrial and domestic sectors majorly depend on ground water. Annual utilizable ground water resources in India is assessed as 433 bcm. The main source of ground water is the recharge from monsoon precipitation. About 58% of countries annual rechargable ground water is contributed by monsoon rainfall. Other sources of recharge viz. seepage from canals, tanks, ponds and other water structures and irrigation account for about 32%. Among the states of India Uttar Pradesh has highest net annual ground water availability (~ 72 bcm) while Delhi has the least (0.29 bcm)(Central Ground Water Board 2014).
Figure 1 Precipitation scenario in India (2000-2014) (Government of India 2018)
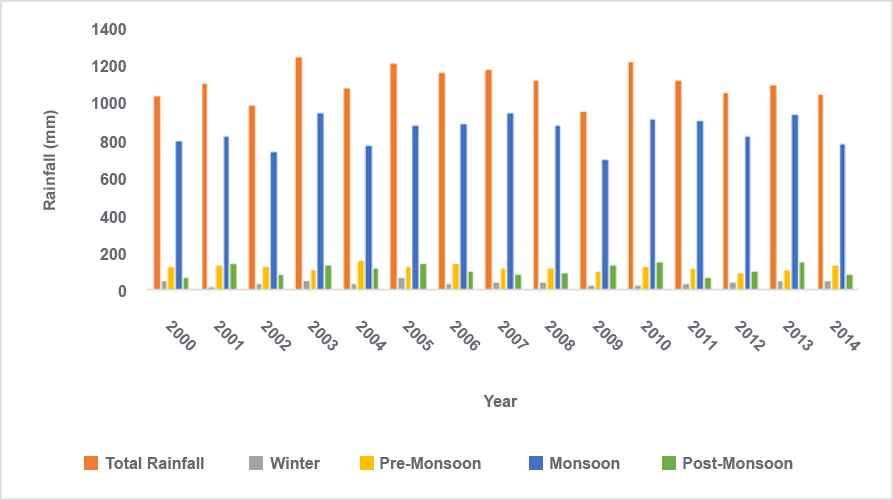
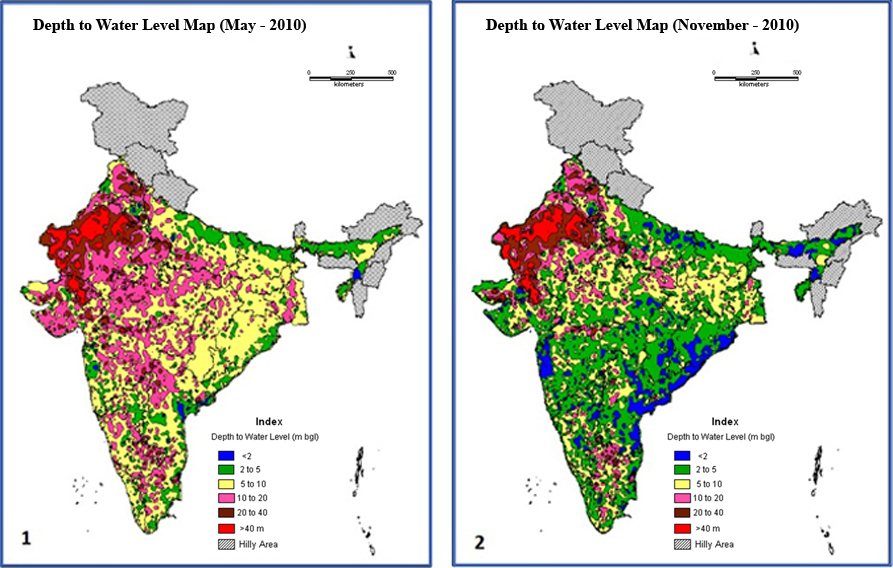
Figure 2 Depth to water level in (1) pre-monsoon and (2) post-monsoon season in India (Central Ground Water Board 2014)
Supply - Demand - Projections
India is one of the most populous countries in the world, which supports about 17.1% (> 1.3 billion) of world’s population and about 500 millions of livestock population that accounts for 20% of world’s livestock population(Gangwar 2013). In last three decades remarkable economic growth is observed in India. Booming economics, population growth and rapid urbanization have considerable impact on India’s water demand. Changes in the food consumption, lifestyle and landuse pattern also play a major role in water requirement. Although India receives plenty of water as rainfall during monsoon, due to lackof storage only a small percentage of that water is actually added to the reserve. In a country like India where there is significant mismatch of spatial distribution of available water with the population, the situation becomes alarming; ironically less water is available where more people live. While, as per the international norms, countries with per-capita water availability less than 1700 m3 per year is categorized as water stressed, with per capita available water of 1545 m3 India is definitely water stressed country (India-WRIS wiki 2015, Census, 2011). Studies shows that the projected per capita water availability will become 1401 m3 and 1191 m3 by 2025 and 2050 respectively and eventually India is likely to become a water scarce country (India-WRIS wiki 2015, Gangwar 2013).
India's total annual utilizable water resources is 1123 bcm (690 bcm surface water + 433bcm ground water). Being an agrarian country, irrigation by far is the largest user of India’s water reserve with hooping usage of 78% of total water reserve, followed by domestic sector (6%) and industrial sector (5%)(Press Information Bureau 2013). Ground water is an important source for irrigation as well as for domestic and industrial usage. It is also a major source of drinking water in urban and rural India. 45% of total irrigation and 80% of domestic water come from ground water reserve. India has abundant ground water reserve which gets replenished every year mostly by monsoon precipitation. However, in some states viz. Delhi, Punjab, Haryana and Uttar Pradesh over exploitation of ground water has led to water scarcity. States like Rajasthan and Gujarat arid climate leads to water stressed condition, while in Tamil Nadu, Karnataka and Andhra Pradesh poor aquifer properties are responsible for water scarcity. With increasing population pressures, industrial growth and unprecedented pace of urbanization the ground water is extracted from lower and lower level with much faster rate than rainfall can even replenish.
On account of rapid economic and demographic change, the water demands in all the sectors are increasing. According to the projections by National Commission on Integrated Water Resources Development (NCIWRD) the irrigation sector alone is going to need additional 71 bcm by 2025 and 250 bcm of water by 2050 compared to the demands of 2010 (Press Information Bureau 2013). Similarly other sectors are very likely to have increased water demand (table 2). While a considerable amount of water requirement is met by ground water, a long term analysis of water recharge in both pre-monsoon and post- monsoon seasons shows lowering of water table due to limited recharge (Sakthivadivel 2007). If this trend continues, India is going to face huge water deficit in future, especially in the irrigation sector. While per capita available water is projected to decrease or remain same, per capita water use is projected to increase from 99 l/d (2009) to 167 l/d (2050). Average domestic water demand would also increase from 85 litters per capita per day (lpcd) in 2000 to 125 lpcd and 170 lpcd by 2025 and 2050 respectively. Total industrial water demand is also supposed to increase to 92bcm and 161 bcm by 2025 and 2050 respectively(MInistry of Statistics and Programme Implementation 2011).
Table 2 Sector wise projected water demand in India (Press Information Bureau 2013)
| Sector | Water demand in bcm | |||||
|---|---|---|---|---|---|---|
| 2010 | 2025 | 2050 | ||||
| High | Low | High | Low | High | Low | |
| Irrigation | 543 | 557 | 561 | 611 | 628 | 807 |
| Drinking Water | 42 | 43 | 55 | 62 | 90 | 111 |
| Industry | 37 | 37 | 67 | 67 | 81 | 81 |
| Energy | 18 | 19 | 31 | 33 | 63 | 70 |
| Other | 54 | 54 | 70 | 70 | 111 | 111 |
| Total | 694 | 710 | 784 | 843 | 973 | 1180 |
How safe is our water?
Rise in demand and development pressure changing the characteristics of water in India. The ground water is more depleted and less available and surface water is getting more and more polluted and unsuitable for human use. Good water quality is essential for human health as well as the ecosystem. However, to ensure sufficient healthy water to everyone is a big challenge now. About 70% of surface water resource in India are polluted. The major contributing factor for water pollution are wastewater from different sources, intensive agriculture, industrial production, infrastructure development, untreated urban runoff and wastewater. According to WHO half of India’s morbidity is water related (Murty and Kumar 2011). Waste management has not been as efficient as required to manage increasing volume of waste generated daily in India, especially in cities. Municipal wastewater treatment capacity developed so far in India accounts for only 29% waste generated in urban habitations having population more than 50,000 and the gap is projected to increase. Domestic effluents contributes a substantial proportion of water pollution in India. More than 70% of domestic untreated effluents are disposed off to environmental media. Water quality data from CPCB shows that organic and bacterial contamination are becoming increasingly critical in water bodies leading to gradual degradation of water quality. Biological Oxygen Demand (BOD) for most of the rivers of India are increasing and exceeding the standards (Bhardwaj 2005).
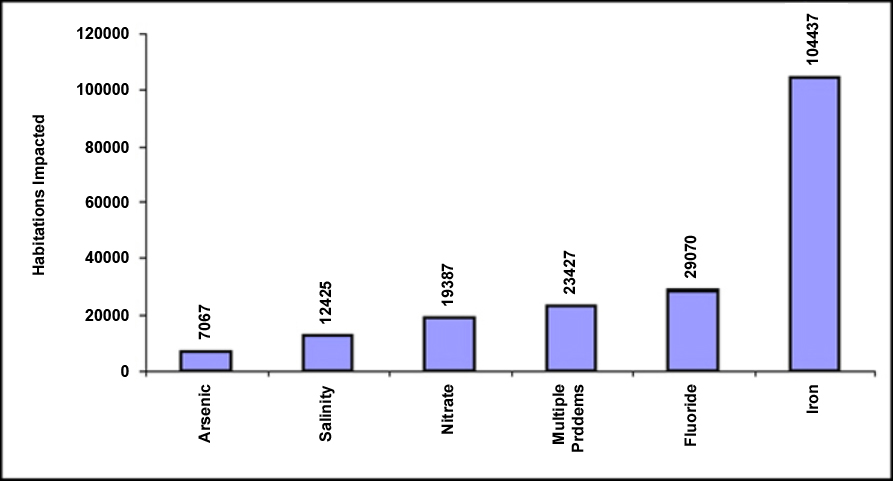
Arsenic and fluoride contamination in ground water is another challenge that India has to combat. Parts of Assam, Bihar, Uttar Pradesh, Chhattisgarh and West Bengal are suffering from contamination of arsenic in ground water above permissible limit, while Andhra Pradesh, Assam, Bihar, Chhattisgarh, Delhi, Gujarat, Haryana, Jammu & Kashmir, Jharkhand, Karnataka, Kerala, Maharashtra, Odisha, Punjab, Rajasthan, Tamil Nadu, Uttar Pradesh and West Bengal are known to have fluoride contaminationalong with (Central Ground Water Board 2010).
Figure 3 Number of habitations affected by water quality problems in rural India (Khurana and Sen 2008)
Climate Change and its implications on water
Changes in temperature and precipitation due to global warming and related processes have serious impacts on hydrologic processes and regional water resources of India. Climate affects the supply and demand of water as well as its quality, especially in arid and semi-arid areas. IPCC AR5 reports that mean annual temperature is increasing all over Asia and it is projected to increase >20C till the end of 21st century (BAU scenario)(Hijioka 2014). Rising temperature contributes to glacial melts resulting in glacier retreat and affecting the water availability in Himalayan rivers, thus threatening the water supplies on which hundreds of millions of people depend. Almost 67% of the glaciers in the Himalayan mountain ranges has retreated in the past decade due to warming effects. Any shortfall in supply of water will have multi fold impact on social, environmental and economic well being affected areas. As water availability is becoming less predictable, drought situations in some parts of India are more likely in future. Water scarcity not only has immediate effect on agricultural productivity but also has a long term impact on socio-economics of the affected area. IPCC projects an increase in both the mean and extreme precipitation in the Indian summer monsoon. The frequency of heavy precipitation events is also increasing, while light rain events are decreasing.Increase in precipitation intensity within a short period leads to flood events and eventually pollute water points. More floods and droughts are predicted in future due to climate change. Extreme rainfall events are very likely in three major river basins viz. Krishna, Godavari and Ganga by 2100. It has been predicted that the dry season will become drier and wet wetter. The situation will become worse when precipitation decreases in the major food producing regions of India. Uneven distribution of precipitation also affects ground water recharge and eventually available water from this source. Most of the rivers in south peninsular India viz. Cauvery, Narmada and Mahanadi are fed through groundwater recharge and is also supplemented by the monsoon rains. Long term projection shows that increase in monsoon precipitation will increases the possibility of floods in September and water scarcity in summer in these rivers.
Most of Asia's non-Arctic coastal ecosystems are under severe pressure from non-climate impacts that climate impacts are hard to detect. In India while most of the land mass is facing water scarcity, the coastal regions are vulnerable to sea level rise, storms and cyclones, salt water intrusion and coastal flooding due to climate change. Average global sea levels are projected to rise at a rate of 2 to 3 mm per year over the coming 100 years. In India even a small amount of rise in sea level will have considerable impact because of high population density.
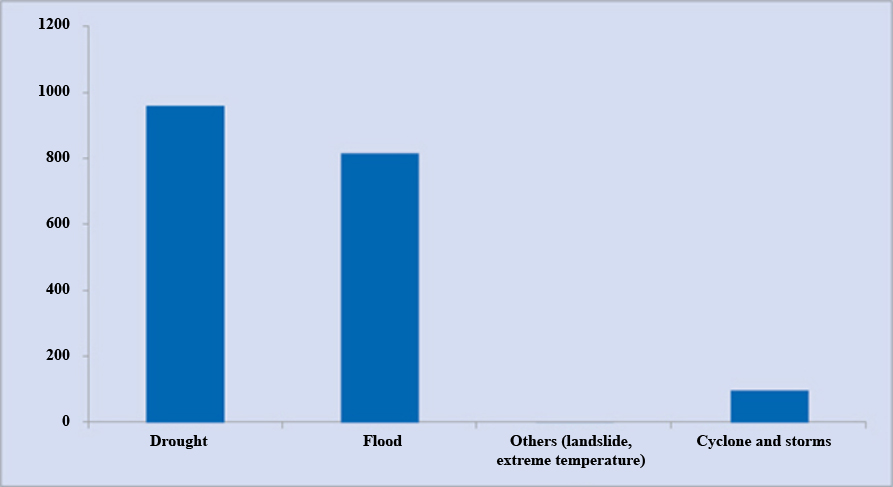
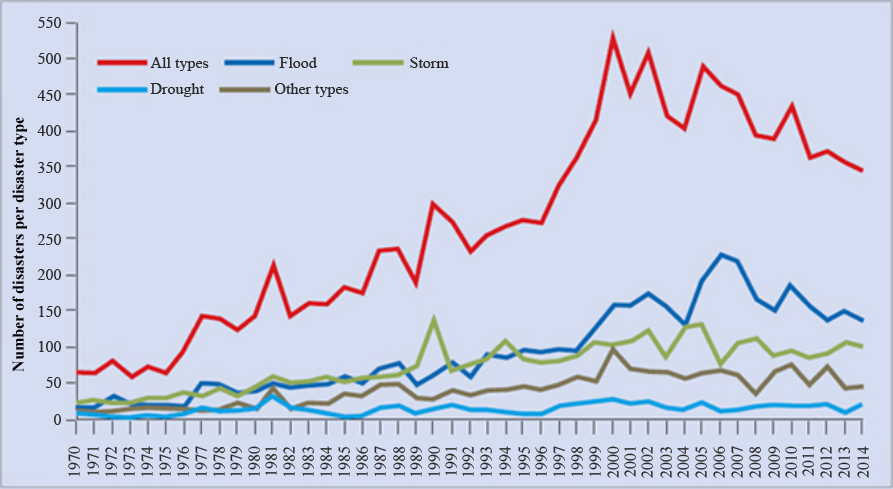
Figure 4 Frequency of natural disasters globally between 1970 and 2014 (Source: EM-DAT)
Water Disasters: Trends
Increasing frequency of natural disasters are observed around the world (Figure 4). India is also highly vulnerable to water related disasters such as floods, droughts and cyclones. More than 12% of India’s geographical area is flood prone(Ministry of Home Affairs 2015). Floods are recurrent phenomena and cause huge losses of life and property. Marginalized suffers the most. It is a cause for concern that flood related damages show an increasing trend. It is observed that while during 1965-75 the number of flood events was lower than 20, it has increased to 100 during 2005-2015. India has faced 649 disasters from 1915 to 2015 out of which 302 were caused by flood with an average of 3 floods per year. This accounted approximately 47% of total disasters took place in India in last 100 years. The average annual flood damage in during the period of 1996 to 2005 was Rs. 4745 crore as compared to Rs. 1805 crore, the corresponding average for the previous 53 years. If we look at top ten disasters in the last ten years we find that flood alone had killed nearly 84% of the total person killed by the top ten disasters(Tripathi 2015).
Table 3 Flood and related damaged in India during 1915-2015 (Tripathi 2015)
| Sub-type of flood disaster | Events count | Total deaths | Total affected | Total damage ('000 US$) |
|---|---|---|---|---|
| Riverine flood | 143 | 29810 | 333442962 | 41404929 |
| Flash flood | 23 | 7436 | 23443526 | 416200 |
| Coastal flood | 4 | 569 | 11500000 | 275000 |
| Other | 132 | 33611 | 462703212 | 11898059 |
On an average, 28% of the geographical area of India is vulnerable to drought(Samra 2004). Temporal studies has shown no trend in number or frequency of drought event in India. In depth studies indicates that the drought occurrences in east Uttar Pradesh, Bihar, Assam and Meghalaya are most alarming. Kerala, Tamil Nadu, Chhattisgarh, Jharkhand, Odisha, east Madhya Pradesh, Uttaranchal, west Uttar Pradesh, Punjab, Himachal Pradesh are also in alarming stage with respect to drought events as many districts in these states reported increasing trends in drought occurrences (Gupta, Tyagi and Sehgal 2011). Probability of drought occurrences in India, based on 115 years of data, varies between 10 - 26 % with central and peninsular India having the higher probabilities. Trend analysis on the time series of area under drought condition shows that seven meteorological subdivisions viz. Uttarakhand, east Uttar Pradesh, Jharkhand, Chhattisgarh, Assam & Meghalaya, Nagaland, Manipur, Mizoram & Tripura and Kerala having a significant increasing trend in the area under drought condition(Guhathakurta 2017).
Tropical cyclones are very common in the coastal regions of India. The coastline of India expands about 7516 kms and exposed to nearly 10% of the world’s tropical cyclones. Sea Surface Temperature (SST) is a trigger to tropical cyclones for their genesis and intensification. Global warming heats both sea surface and deep water, thus creates ideal conditions for a cyclone to survive and thrive in its long journey. SST increasing is so fast and is high in the equatorial Indian Ocean compared tothe other oceans. It has increased 0.6°C over the North Indian Ocean. Recent increase in severity of tropical cyclones in Bay of Bengal region is because of the increase in SST since 1960, the largest warming among the tropical oceans. The increasing trend in the cyclone frequency over the Bay of Bengal for the last 122 years during May has been + 0.36. Keeping in view the average frequency of one cyclone every three years in May, this trend is highly significant (Mishra 2014).
Figure 5 Persons affected by natural disasters in India during 1970 to 2014 (in millions) (Source (EM-DAT)